
Field trial in Mauritius
INTRODUCTION
This broiler performance experiment was designed to evaluate the effects of butyric acid in broiler feed during a 42-day pen trial. The hypothesis is that butyric acid, which is an organic acid, increases the biological performance of broiler chickens. In so-doing, we would expect to have a higher Live Body Weight (LBW) of broilers, better Feed Conversion Ratio (FCR) and decreased Mortality Rate. The benefits of butyric acid are well known in the poultry industry. Effects which are attributed to butyrates include:
-
Better nutrient digestibility which results in an increase in performance
-
Stimulation of secretion of digestive enzymes
-
Optimization of intestinal microbiota and an improvement of the epithelial integrity and defence systems
-
Tissue development and repair in the digestive tract
-
Down-regulation of bacterial virulence
-
Control of gut health disorders caused by bacterial pathogens, especially in young birds
The trial was conducted at Riche-Bois farm which is situated in the district of Savanne, Mauritius.
METHODOLOGY
For the purpose of this trial, a total of 600 day-old broiler chicks (DOC) (both sex) were collected from the hatchery of New-Grove. The chicks were randomly allocated into 2 treatment groups T1 and T2, having 300 chicks in each group. In T1, the feed contained butyric acid and in T2, no butyric acid was present (negative control). Each treatment had 6 replicates of 50 birds. The broiler breed used was Cobb-500, more precisely the flock number 308C2.
A total of 12 floor-pens (Fig. 1) of equal size were set up in an open-sided house to accommodate the birds for a cycle of 42 days. Each pen contained feeder plates and founts for proper feeding and drinking. Litter of wood shaving materials to a depth of 3 cm was spread on the floor of each pen to maintain a comfortable environment for the birds. Feeder plates and bell drinkers were disinfected before placement of broilers and brooding was done using infra-red lamps.

Fig. 1 Set-up of 12 floor-pens
The experimental design followed for this experiment was a completely randomized block design as shown in figure 2.

Fig. 2 Allocation of treatments
The feed program used is shown in the table below and the same vaccination program that was already being implemented on the farm was used.
|
PHASE |
Feed presentation |
Age (Age is indicative only) |
Feed/bird (grams) |
Total feed (600 birds)/kg |
|
Pre-starter |
Crumbles |
1-7 |
300 |
180 |
|
Starter |
Crumbles |
8-14 |
300 |
180 |
|
Grower |
Pellets |
15-25 |
1000 |
600 |
|
Finisher |
Pellets |
26-34 |
1300 |
780 |
|
Post-finisher |
Pellets |
35-40 |
800 |
480 |
Fig. 3 Feeding program
On the day of arrival to the farm, the LBW of the DOC was recorded by weighing the birds individually using an electronic balance. Then 50 birds were allocated in each pen. Mortality was recorded daily, while body weight and feed intake were recorded on day 5, 7, 10, 15, 21, 28, 35 and 42. Calculations of Mortality Rate, Average Daily Gain (ADG), FCR and FCR corrected for mortality were done on the aforesaid day intervals.
RESULTS AND DISCUSSION
Variance in weight of Day-old Chicks (DOC)
Before the pen trial started, it should be ensured that there was little variance in weight of the DOC in the two treatments. The level of uniformity basically dictates the final result; poor flock uniformity goes hand in hand with delayed growth, rejects, and poor FCR. One way of proceeding was the selection of DOC whose weight was between 43-53 grams. Chicks above 53 grams were included in the trial, but there was very few occurrences of that weight. Another way to analyze variation is by calculating the Coefficient of Variation (CV). The Coefficient of Variation of the day-old chicks were 7.06% and 6.87% respectively for A and B. The lower the CV%, the more uniform and less variable the flock is.
Average weight (0-42 days)
Changes in LBW from day 1 to 42 are graphically presented below. At 5 days of age, body weight differed significantly (P<0.05) between the 2 treatments. Birds in treatment A recorded heavier body weight compared to birds in treatment B. Final weight differed significantly (P<0.05) between the two treatments, i.e. a difference of 75.32 grams. Birds in treatment A were the heaviest (2346.73 g) at 42 days of age compared to birds in the control (2271.41 g).
|
Days
|
Treatment A (Butyric Acid)
|
Treatment B (Control)
|
Difference in Weight
|
|
0
|
47.86
|
47.98
|
-0.12
|
|
5
|
120.45
|
116.92
|
3.53
|
|
7
|
167.90
|
157.67
|
10.22
|
|
10
|
264.43
|
239.08
|
25.35
|
|
14
|
452.02
|
415.82
|
36.20
|
|
21
|
894.05
|
830.55
|
63.50
|
|
28
|
1416.89
|
1352.55
|
64.34
|
|
35
|
1928.90
|
1854.28
|
74.62
|
|
42
|
2346.73
|
2271.41
|
75.32
|
Table 1. Mean weight of broilers for treatment A and B (0-42 days)
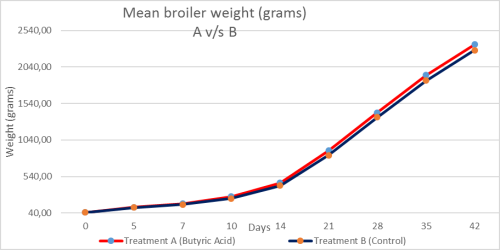
Graph 1. Mean weight of broilers in grams 0-42 days
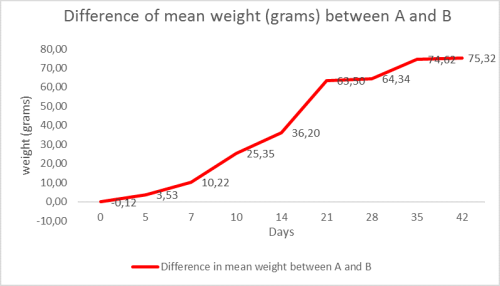
Graph 2. Difference in mean weight of broilers in grams 0-42 days
Feed Conversion Ratio
FCR was influenced by butyric acid all over the cycle, meaning that an improved FCR was obtained in treatment A as compared to treatment B. Significant differences were obtained (P<0.05), which confirms the hypothesis that butyric acid improves the FCR of broiler chickens.
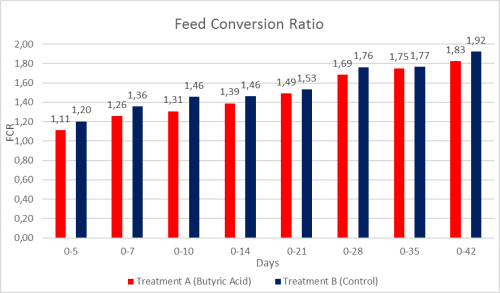
Graph 3. Feed conversion ratio (FCR) at different phases (0-42 days)
From this pen trial, it has been proven that butyric acid improved the LBW (P<0.05), ADG (P<0.05) the FCR (P<0.05). All the parameters have better final results as compared to the control. These results are in agreement with the results reported by the supplier of the feed additive. Even though histological analysis of the broilers was not performed, from these results we can deduce that there has been an improved digestion and absorption of nutrients, accompanied with a positive effect on the intestinal activity of the intestines.
Mortality
The cumulative mortality curve below shows the number of birds left for each treatment at specific day intervals of the cycle. The livability of the two treatments during the experimental period at day 42 were 4.67% and 5.00% in treatment A and B respectively. Mortality rate between the two treatments throughout the entire rearing period did not show any significant (P>0.05) difference between the treatment groups.
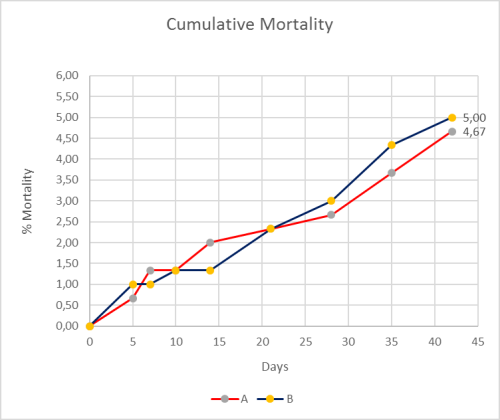
Graph 4. Mortality rate (cumulative) during the trial period
Post mortum analysis done on the deceased birds revealed that death was caused by flip-over. The livability of the birds was unaffected in the two treatment groups throughout the trial period. Birds of treatment B grew less than in treatment A, even though the livability of these two group of birds were identical during the 42th days of age. Therefore it can be deduced that butyric acid did not affect the bird livability.
Litter Quality
The same litter was used at the start of the trial. But at day 5, it was noticed that there was a difference in the litter quality between treatment A and treatment B. There were more droppings in treatment B as compared to treatment A and the droppings were more watery in B. One possible conclusion is that butyric acid is having a positive effect on the gastrointestinal health of the chicks. In figure 3 a sample of litter found in treatment A pens is seen. The litter was dry and did not stick in hands when clumps were made. Also, there were less droppings compared to treatment B.
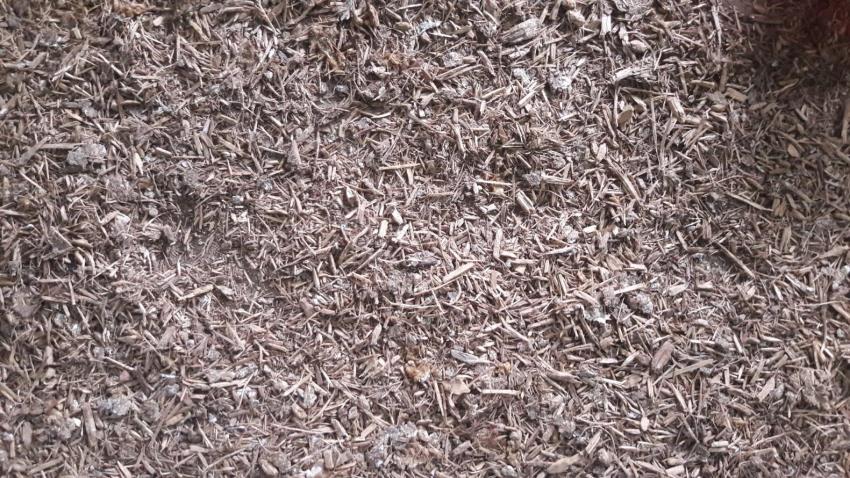
Fig. 3 Litter quality in treatment A
The litter quality in treatment B can be seen in figure 4. There were more droppings on the litter in treatment B and the amount of moisture was higher as compared to treatment A. the droppings were more watery and this made the litter to stick.
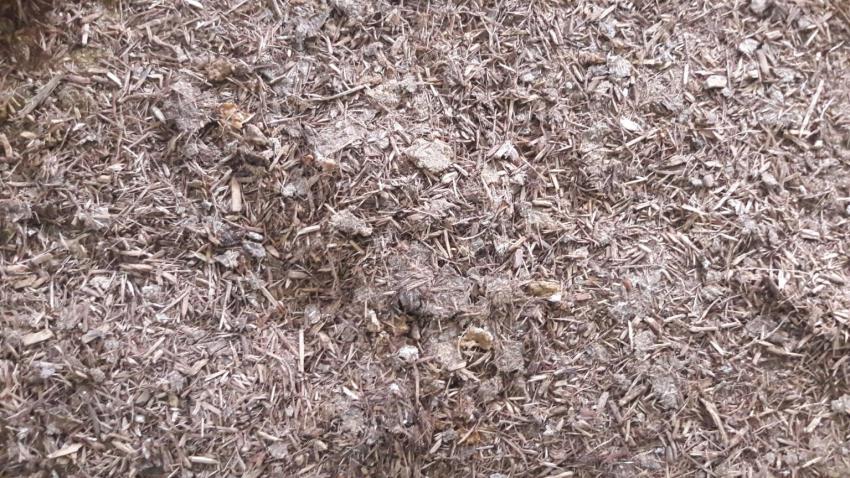
Fig. 4 Litter quality in treatment B
CONCLUSION
It can be concluded that birds in treatment A supported comparatively better growth responses in terms of body weight, feed efficiency and average daily gain than those of treatment B (control). So, butyric acid may be recommended as a feed additive to increase the performance of broiler chickens.